Analysis of Case Studies using EDERA Products

Case Study 1: Pomar de Cinca, 25th May 2023 (Riverine flash flooding)

Example of use of the platform in a river flash flood case (Part 1/2). Flash Flood Summary Layers 

Zoom in on the area of interest to begin analysing the EDERA forecast. In this case, the event occurred in Pomar de Cinca, northeastern Spain, on 25th May 2023, where river levels rose by 5 meters from 15:00 UTC.

Area of riverine flooding event in Pomar de Cinca, northeastern Spain on 25th May 2023.

Load the forecast on the 25th May 2023 at 06:00 UTC: Review the Official Warnings layer to check if the region has an active warning from the Local Meteorological & Hydrological Services.

  • Have any warnings been issued?
  • Do they cover the region of interest?
  • What periods are covered by these warnings?
  • Does the ‘sub-catchment summary layer’ highlight any flood signals during the same period for your area of interest?
An official Warning for severe rainfall was issued for Centro de Huesca, northeastern Spain on 25th May 2023. 1-h accumulations of precipitation in exceedance of 30mm were forecasted for the region.

From ~1-2 hours before the expected arrival of the event – in this case from 15:00 UTC on 25th May 2023

  • Check the latest forecast each hour
  • For river flash flooding -> check the Sub-catchment summary layer. If sub-catchments are highlighted, click on them to view the likelihood of the event versus the level of exposure.
    • If sub-catchments are highlighted (see image below -> check the Animated Flash Flood Nowcasting layers and use the animation slider to view the forecasted evolution of the event)
    • These layers will capture the riverine flash flood risk but not the risk of urban (pluvial) flooding – see the next bullet point
  • For urban flooding: Review the Storm Impacts layers every 15 minutes to monitor any flash flood signals.

The flash flood impact over the sub-catchment summary layer shows the impact matrix which illustrates the likelihood of the event vs the level of exposure. Exposure information is also displayed in the pop-up window.

Within the Storm Impact layers, the Precipitation Hazard product at 15:00 UTC on the 25th May 2023 already shows the risk of urban flooding as shown by red, orange and yellow ellipses in the image below.

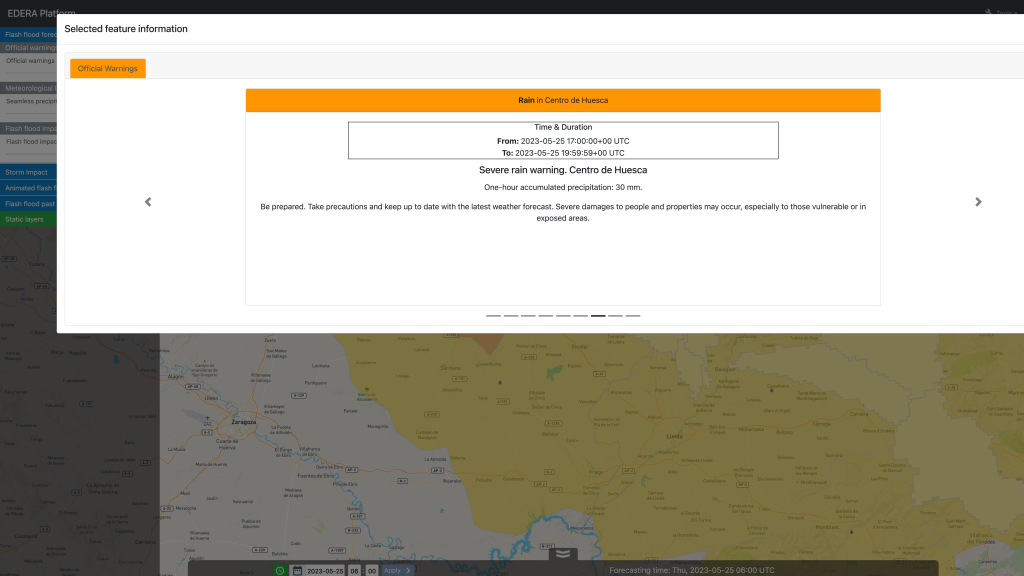
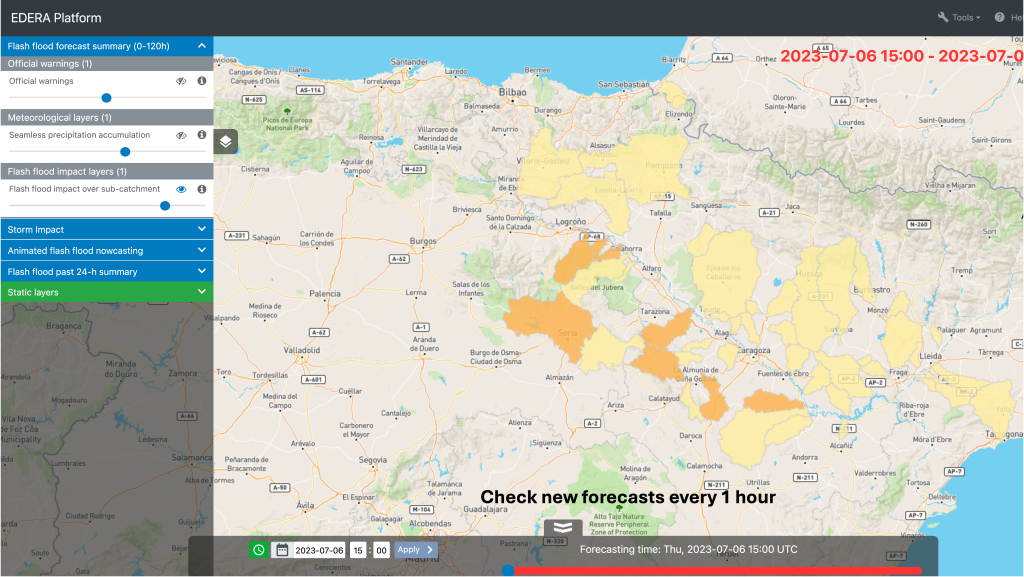
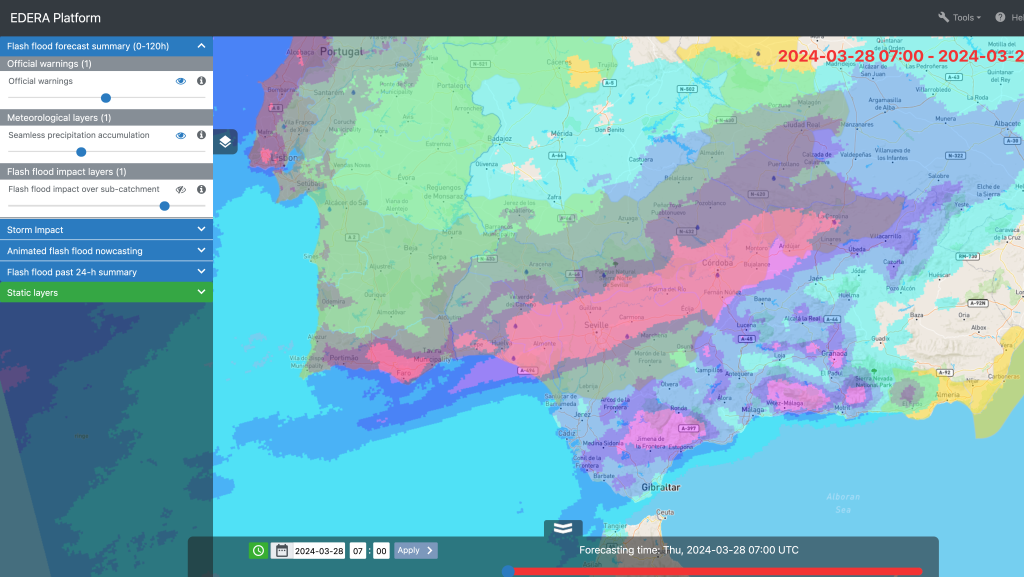
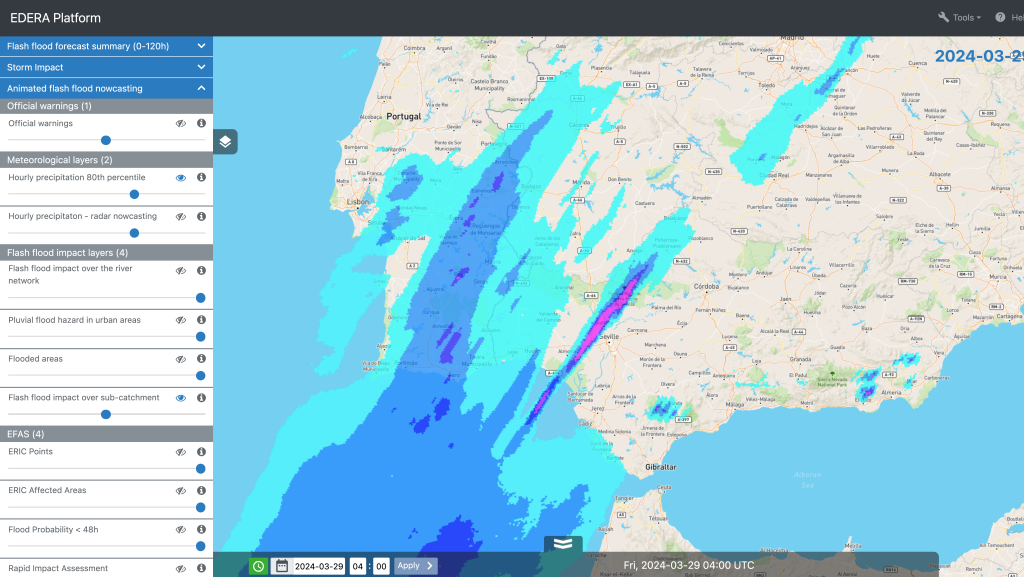
  • Continue to monitor the Flash Flood Impact layers (over the river network and sub-catchment) hourly to track the event’s evolution.
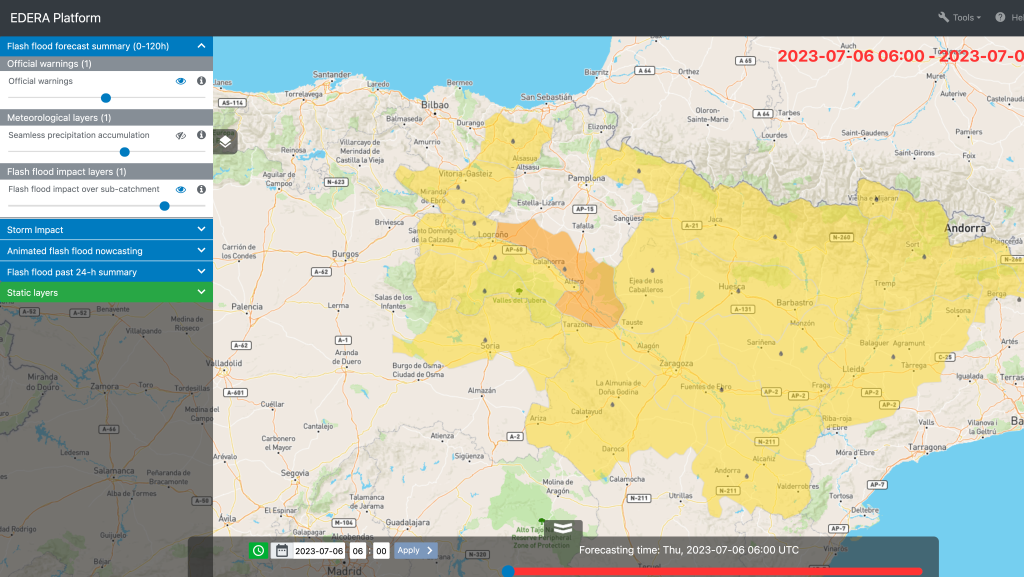
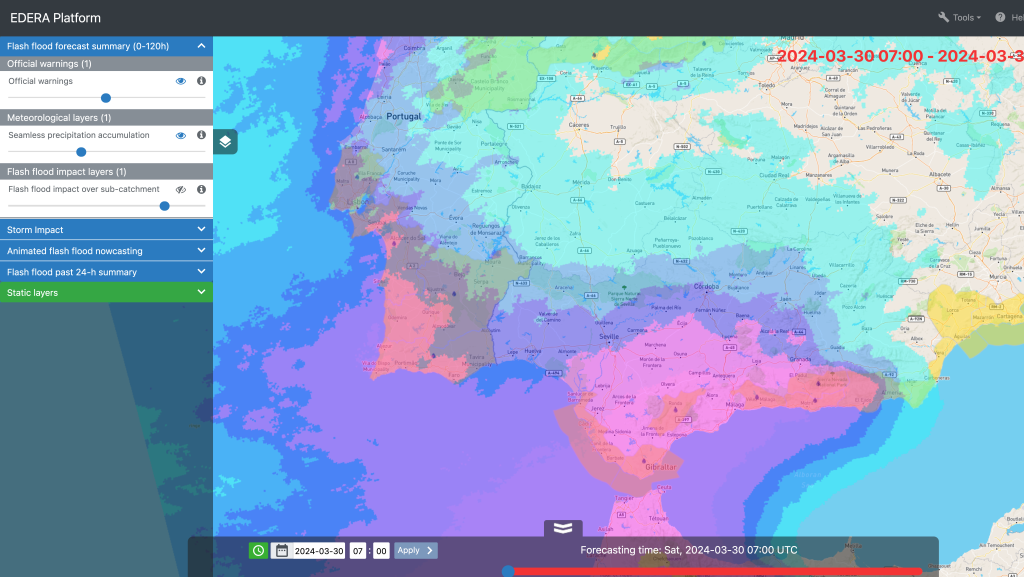
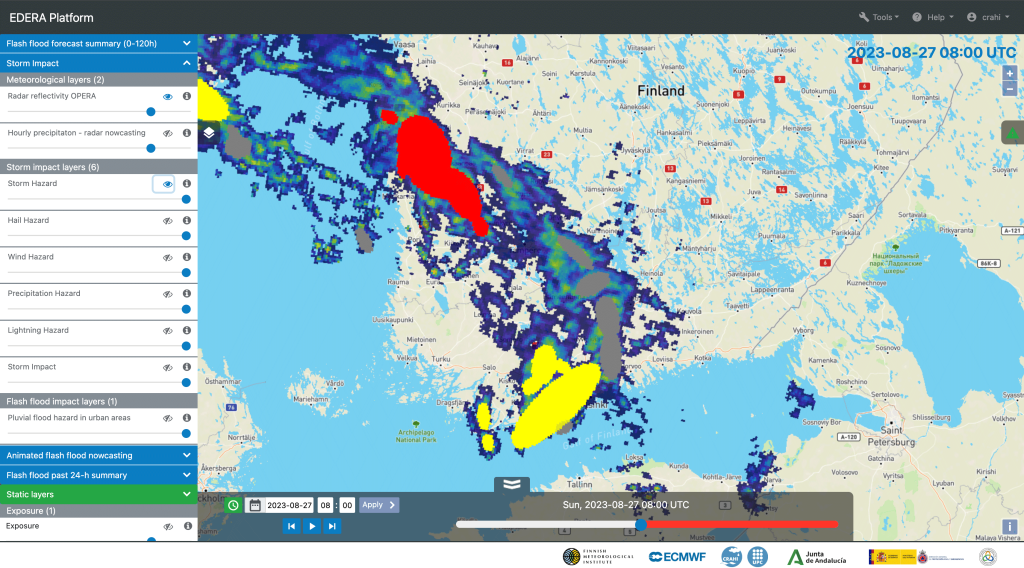
Example of use of the platform in a river flash flood case (Part 2/2). Flash Flood Summary Layers 
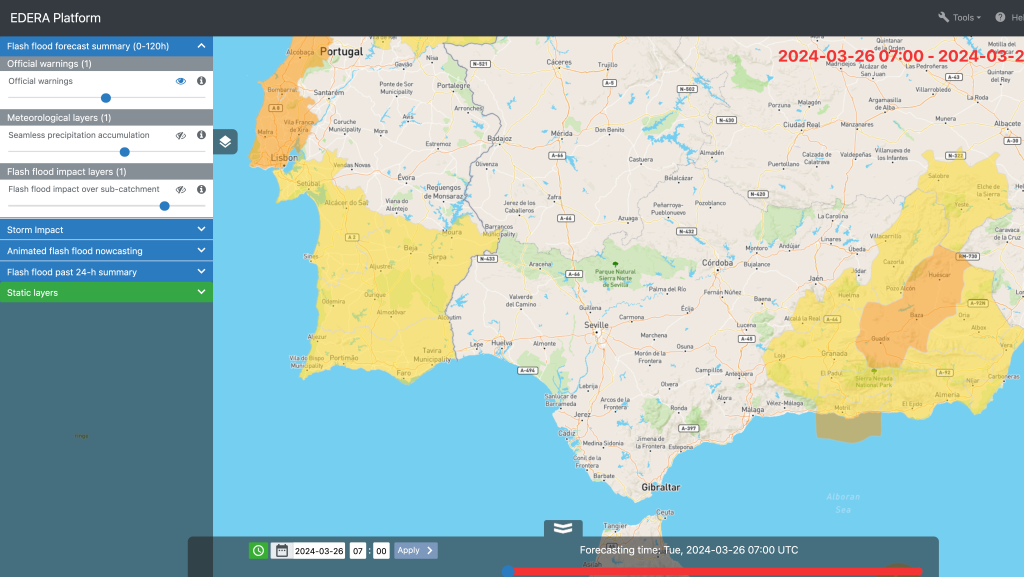
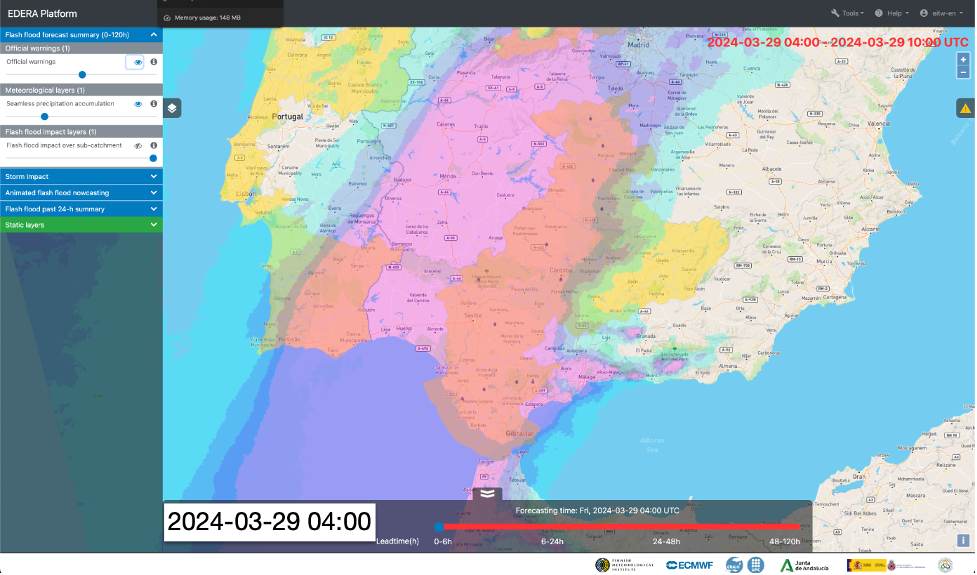
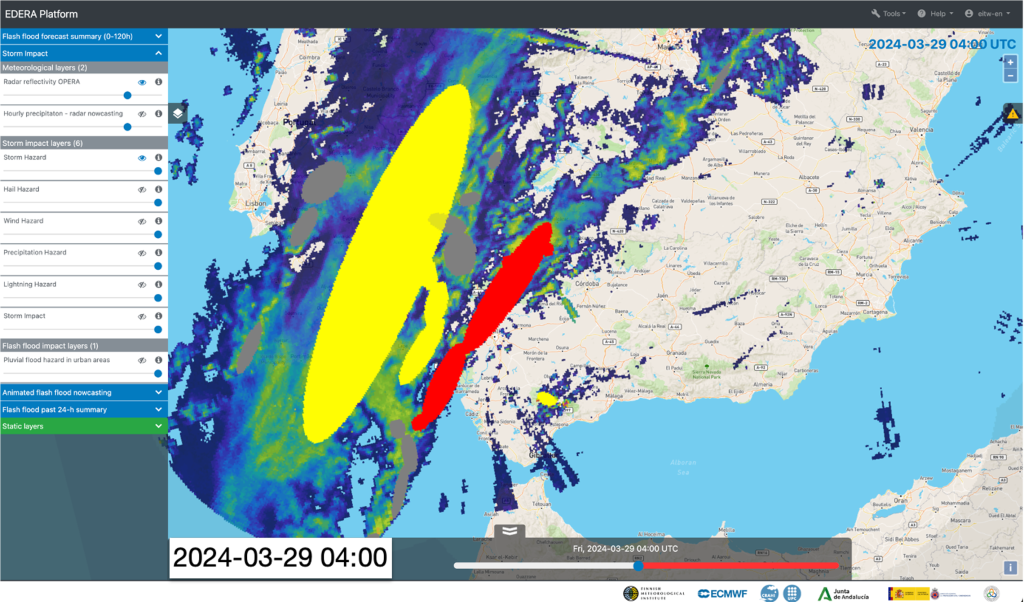
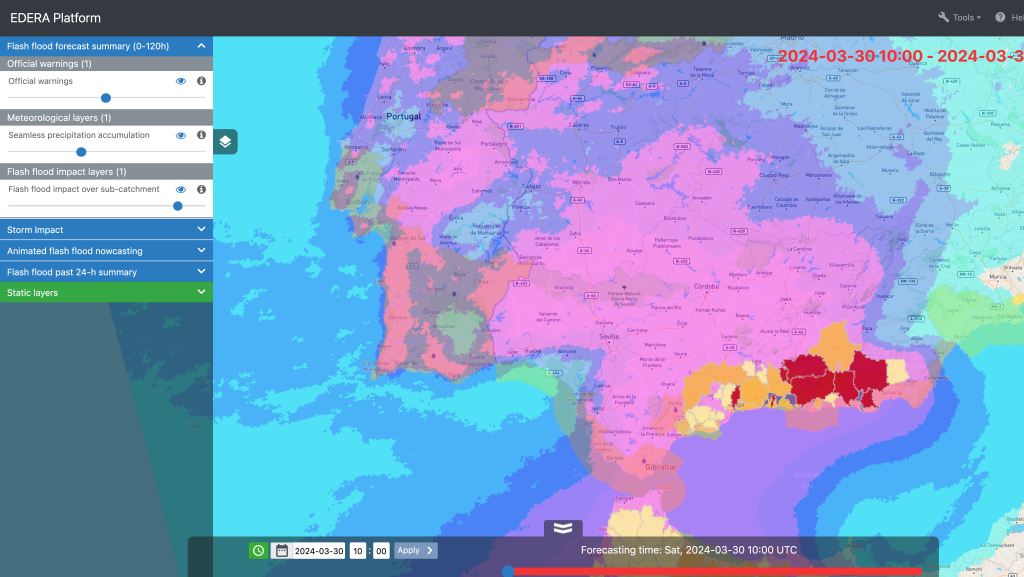
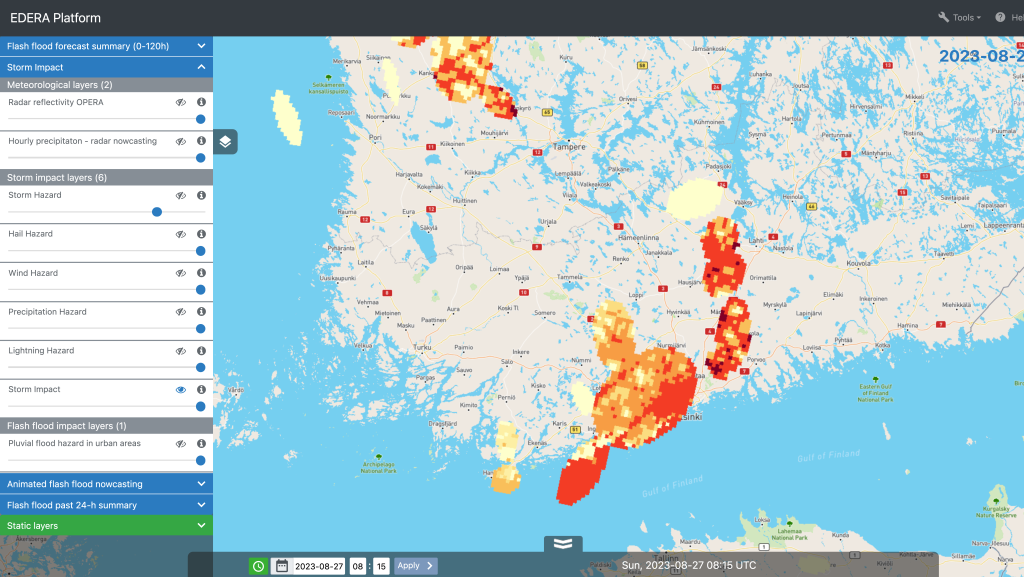
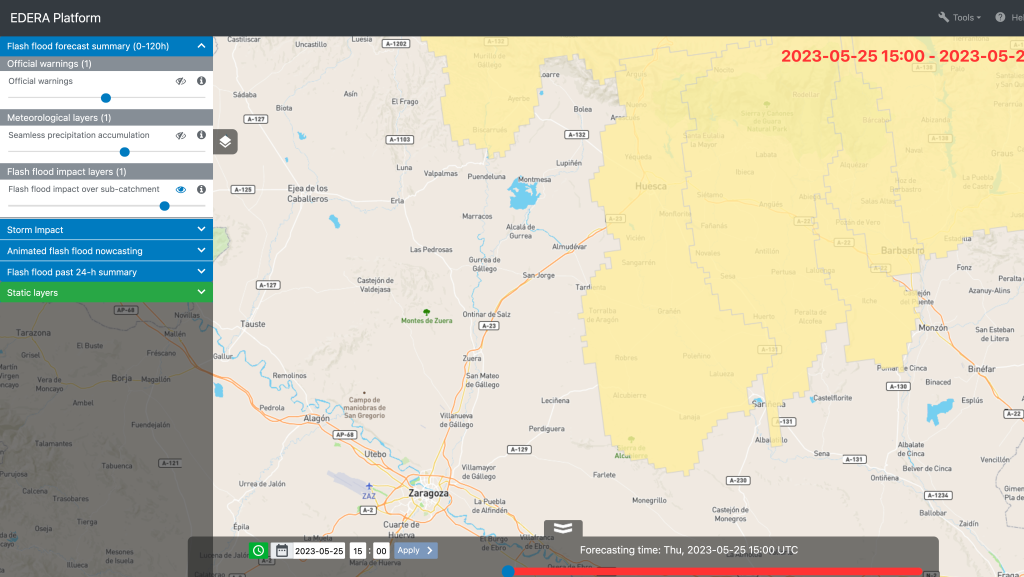
Case Study 2: Zaragoza, 6th July 2023 (Urban flash flooding)

Zoom in on the area of interest to begin analysing the EDERA forecast. In this case, the event occurred in Zaragoza, northeastern Spain, on 06th July 2023, where hail, heavy rainfall and flooding impacted localised areas from 13:00 UTC to 21:00 UTC.

Area of urban flooding, heavy rain, and hail event in Zaragoza, northeastern Spain on 06th July 2023.

At 06:00 UTC: Review the Official Warnings layer to check if the region has an active warning from the Local Meteorological & Hydrological Services.

  • Have any warnings been issued?
  • Do they cover the region of interest?
  • What periods are covered by these warnings?
  • Does the ‘sub-catchment summary layer’ highlight any flood signals during the same period for your area of interest?
    Official Warnings for severe thunderstorms were issued for Ribera del Ebro de Navarra (in orange) and Moderate rain warnings were issued for Ribera del Ebro de Zaragoza (in yellow) in northeastern Spain on 06th July 2023. 1-h accumulations of precipitation in exceedance of 15mm were forecasted for the region.

    From ~1-2 hours before the expected arrival of the event – which is 15:00 UTC for this event

    • Check the latest forecast each hour
    • For river flash flooding -> check the Sub-catchment summary layer. If sub-catchments are highlighted, click on them to view the likelihood of the event versus the level of exposure.
      • If sub-catchments are highlighted -> check the Animated Flash Flood Nowcasting layers
    • For urban flooding: Review the Storm Impacts layers every 15 minutes to monitor any flash flood signals.

    At 15:00 UTC: The weather system moves in…

    • Check the River Flash Flood RIsk forecast for each hour of the forecast using the time slider to track the evolution of the event.
    Use the time slider at the bottom of the platform interface to check the flash flood impact forecast for each hour of the event.

    At 15:00 UTC: The weather system is moving in…

    • Check the Storm Impact layers to analyse the urban flash flood risk for each 15 minutes of the forecast using the time slider to track the evolution of the event.
    Use the time slider at the bottom of the platform interface to check the flash flood impact forecast for each hour of the event (observation data is shown in white, and forecasted data in red).
    Case Study 3: Storm Nelson - Spain/Portugal, 26 March to 01 April 2024 (flooding)

    Zoom in on the area of interest to begin analysing the EDERA forecast. In this case, the event occurred across the southern border region of Spain and Portugal, from 26 March to 01 April 2024, which brought strong winds, heavy rainfall, and hazardous coastal conditions to the region.

    Location of Storm Nelson on 26 March to 01 April 2024 in Spain and Portugal.

    On 26 March 2024 at 07:00 UTC: Review the Official Warnings layer to check if the region has an active warning from the Local Meteorological & Hydrological Services.

    • Have any warnings been issued?
    • Do they cover the region of interest?
    • What periods are covered by these warnings?
    • Does the ‘sub-catchment summary layer’ highlight any flood signals during the same period for your area of interest?

    From ~1-2 hours before the expected arrival of the event

    • Check the latest forecast each hour
    • For river flash flooding -> check the Sub-catchment summary layer. If sub-catchments are highlighted, click on them to view the likelihood of the event versus the level of exposure.
      • If sub-catchments are highlighted -> check the Animated Flash Flood Nowcasting layers
    • For urban flooding: Review the Storm Impacts layers every 15 minutes to monitor any flash flood signals
    Official Warnings for rain at the yellow level were issued for Faro in southern Portugal on 26 March 2024 at 07:00 UTC. Showers, sometimes heavy, and occasionally hail accompanied by thunder and strong gusts of wind were forecasted for the region.

    On 28 March 2024 at 07:00 UTC, check the seamless precipitation accumulation layer.

      The seamless precipitation accumulation layer for 28 March 2024 at 07:00 UTC shows a band of heavy rainfall across the southern Spain and Portugal border region.

      At 19:00 UTC on 28 March 2024, check the Radar reflectivity OPERA and Storm Hazard layers.

        The radar reflectivity OPERA and storm hazard layers for 28 March 2024 at 19:00 UTC show heavy rainfall across the southern Spain and Portugal border region and yellow/orange ellipses (moderate/severe hazard) to the north of Huelva and Faro.

        At 04:00 UTC on 29 March 2024, check the official warnings, seamless precipitation accumulation, radar reflectivity OPERA, storm hazard, and hourly precipitation 80th percentile layers.

          At 07:00 UTC on 30 March 2024, check the official warnings and seamless precipitation accumulation layers.

            At 10:00 UTC on 30 March 2024, check the official warnings, seamless precipitation accumulation, and flash flood impact over the sub-catchment layers. Use the time slider to track the evolution of the forecast until the signal dissipates.

              Case Study 4: Helsinki, 27 August 2023 (Flash Floods)
              Location of flash flood event on 27 August 2023 in Helsinki region, Finland.

              A heavy rainfall and flooding event occurred in the Helsinki region on 27th August 2023. To see the development of the event, zoom in to the Gulf of Finland area. The Official Warnings layer on 26th August at 22:00 UTC shows a yellow warning level in Southwest Finland issued by the local meteorological and hydrometeorological services. At that time, the Seamless precipitation accumulation layer shows rainfall accumulations of up to 25 mm/hour during the next 6-24 hours.

                For this case study, we recommend using the Storm Impact layers. These layers are most useful for predicting rapidly developing flash floods for the next couple of hours. During the early morning hours of 27 August 2023, start checking the Radar reflectivity OPERA layer on an hourly basis. Intense storm cells marked with red colour in the Radar reflectivity OPERA layer are approaching Helsinki around 05:00 UTC from the southeast. During the previous hour, the Precipitation hazard layer shows multiple storm ellipses having yellow colours, which is a signal to start preparations for possible flooding in the Helsinki region.

                  The intense rain shower that caused the flooding was relatively short. It happened between 09:00 and 10:00 UTC. Looking at the nowcasts available from the radar reflectivity and hourly precipitation layers at 08:00 UTC, the most intense storm cells appear to miss the Helsinki region from the northern side. Similarly, the pluvial flood hazard nowcast, which is based on the hourly accumulation layer, made at 08:00 UTC predicts red flood hazard levels between 10:30 and 12:00 UTC, but the hazard is not predicted to hit Helsinki. This highlights that these products should be trusted only very close to the expected event (i.e. less than one hour).

                    Because of the high uncertainty in predicting the exact location of storm cells, we recommend looking at the storm impact layers that also show the uncertainty. In the impact nowcast made at 08:15 UTC, multiple storm ellipses with the yellow precipitation hazard level can be seen in the Helsinki region. According to the nowcast, the storm ellipses are expected to remain in this region for the next hour. The uncertainty is represented by the increasing spread of the ellipses, showing that a precipitation hazard has a nonzero probability of affecting Helsinki during the next 45 minutes. The vulnerability of different locations, particularly the densely populated Helsinki region, is highlighted in the storm impact nowcast, which predicts red impact levels between 08:15 UTC and 09:00 UTC.